Tips & Tricks | Estimated Read time – 9:38
You’ve likely heard the chatter around the Google Analytics 4 transition over the past few months. But what does it mean for you as an event organizer?
We know how crucial it is for you to have the right access to your digital data. That’s why we’ve put together a simple, easy-to-understand guide that outlines the four crucial things you need to know about GA4. Our guide will help you manage this transition so you can focus on what you do best: delivering the best experience for your attendees.
In this brief 10-minute read, we will cover four key topics:
- What is GA4?
- What Race Roster is doing to help you with the transition.
- Key changes and concepts in GA4.
- The most important reporting screens you need to keep track of after the transition.
Let’s dive right in!
1. What is GA4?
GA4 is the fourth major release of Google Analytics and the newest iteration of the free website tracking software. GA4 became the default version of Google Analytics on July 1st, 2023, and will be the only option for analytics tracking from Google going forward.

Pro tip:
During your research, you’ll see online resources referring to the old version of Google Analytics as “UA”—Universal Analytics vs. GA4.
Why should you care?
On July 1st, 2023, your existing Google Analytics accounts stopped collecting website data. While you still have access to your historical data, you can no longer see any new website analytics data.
Key takeaway:
Google does offer a migration assistant to help get you started. If you have a relatively straightforward Google Analytics set up now, this tool may streamline your process significantly.
However, getting on to the GA4 platform as soon as possible is crucial, regardless of how complex your setup is, so that you can continue to collect fresh data. More sophisticated filtering and conversion goals can always be set up down the road, but the data you don’t collect on GA4 will be gone forever.
If you do not initiate a migration, Google may automatically transition your existing property to GA4. We highly recommend you and your team complete this process manually because key questions are asked during the migration. This automated transition should be used as a backup option only.
2. The Race Roster platform is ready for your new GA4 property
Over the past months, our technical team has been working hard to ensure that our platform integrates seamlessly with your new GA4 property and associated conversion goals. We have added all the necessary technical functionality to ensure that we can process your new data being delivered from GA4.
Why should you care?
It is important that you connect GA4 and Race Roster accounts together so the right e-commerce and conversion data continue to flow between these platforms. This is crucial for you to understand the performance of your marketing campaigns. It is the first step to ensuring all the data and analytics functionality you’ve previously enjoyed on the Race Roster platform continues to function as expected.
Key takeaway:
We have developed documentation detailing how to connect your GA4 property with the Race Roster platform. The process should take less than 10 minutes and can be completed either by yourself or someone on your team. Don’t forget to complete this step after your GA4 migration!
3. What are the major changes you need to know that will impact you on a day-to-day basis?
A lot has changed in the new version of Google Analytics. While this is the fourth version of Google Analytics, it is the first time it has been completely overhauled.
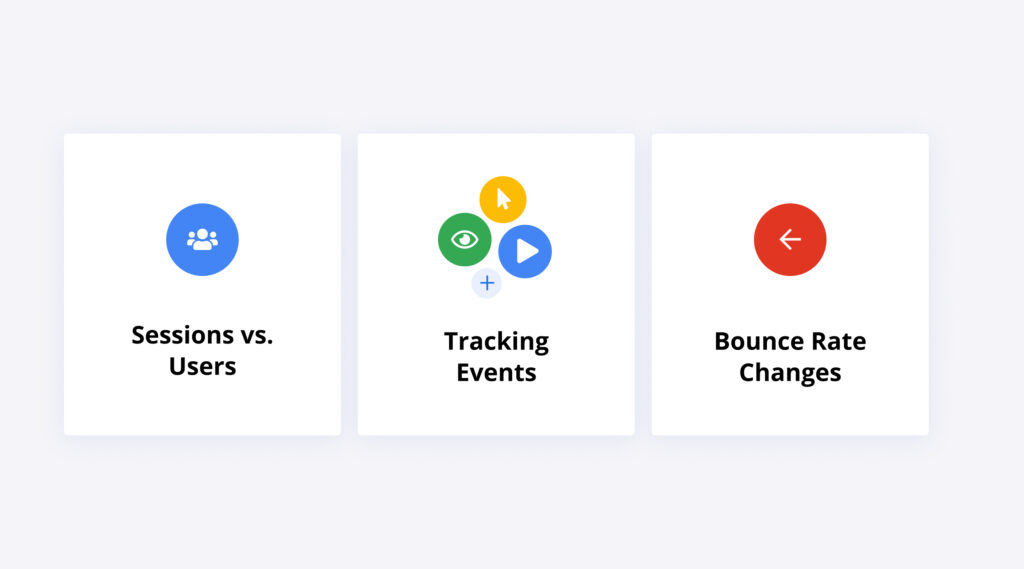
There are three key concepts we want to highlight to help you navigate GA4:
- Session vs. Users
While the old version of Google Analytics had reports primarily focused on sessions (i.e. individual website visits), GA4 is focused more on users (i.e. website visitors who may visit multiple times). This means that four website sessions will now be counted as one user visit. This does not mean your website has suddenly started to get less traffic or your GA4 implementation is broken. It simply means the way data is being counted has been updated. The fundamental changes to how GA4 tracks will result in shifts in metrics. Expect to see similar but not identical numbers between the two platforms. - Tracking Events
The old version of Google Analytics focused primarily on page views and secondarily on other custom event tracking. GA4 can track a wider range of website interactions by default and are all categorized as “events.” Expect to see a variety of new data in your reporting shown as different types of events.
These events can range from simple session starts and clicks to how many users are scrolling on your website, starting videos on your page or using your search bar. Overall, GA4 is attempting to track more important engagements without additional setup and can be an incredibly useful tool for you to get even more insight into your website. You can find a complete list of tracked events here. - Bounce Rate Changes
How bounce rate is measured will now be different. Google is moving away from how we traditionally understand bounce rate—and with good reason. The old metric was often misunderstood. It didn’t measure the value of the page and the potential value of the visit.
In GA4, bounce rate is now measured through engagement. If a user did not engage with your website (like one of the events we mentioned earlier), they will not be counted as an engaged session. As a simple example, if 3 out of 10 visitors engaged with your website, your engagement rate will be 30%, and will lead to a bounce rate of 70%.
The bounce rate is also no longer included in the default report. The best place to access the bounce rate metric in GA4 is within the “Explore” section of the platform.
4. This interface seems familiar but different—what are the reports you should pay attention to?
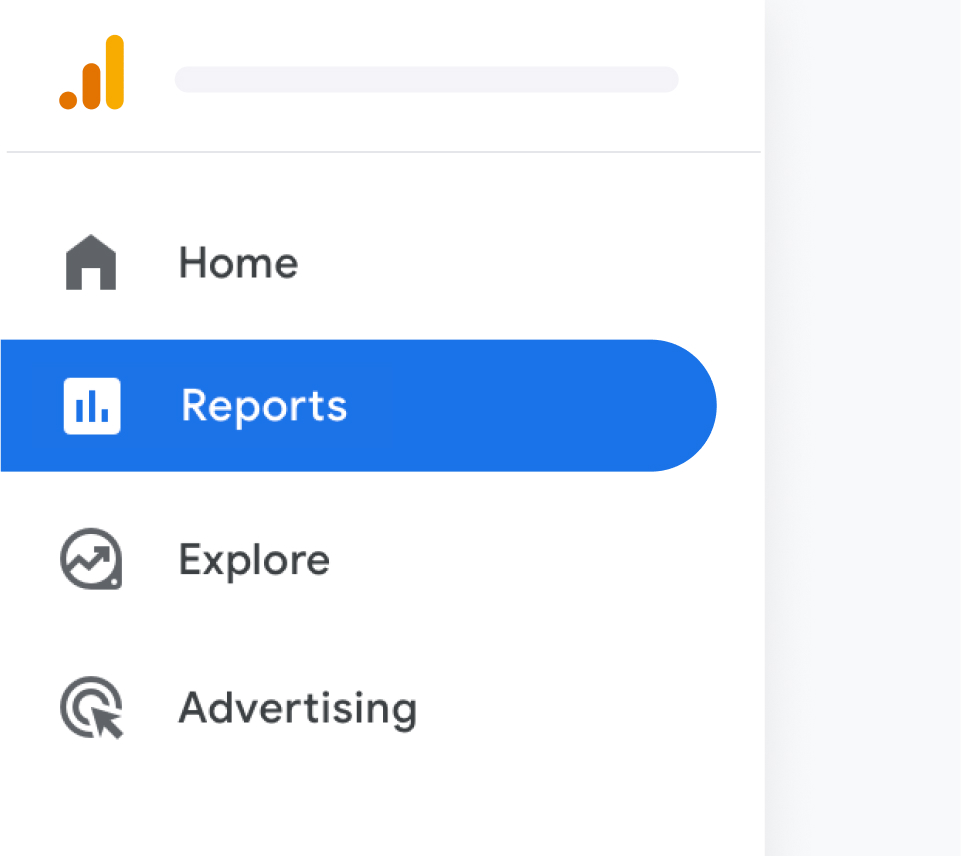
On the left-hand side of your GA4 interface, you will notice the rows of options that you are used to have changed. While each of these new tabs offer important information, we have decided to focus on the most crucial screens that you need to review. These fall under the “Reports” section of the interface. Within the “Reports” section, there are two major areas: “Life cycle” and “User”. Each has sub-sections that contain crucial information. Let’s dive in and break out the most important screens.
Life cycle collection:
The “Life cycle” collection includes the following reports that help you understand user activity from acquisition to conversion:
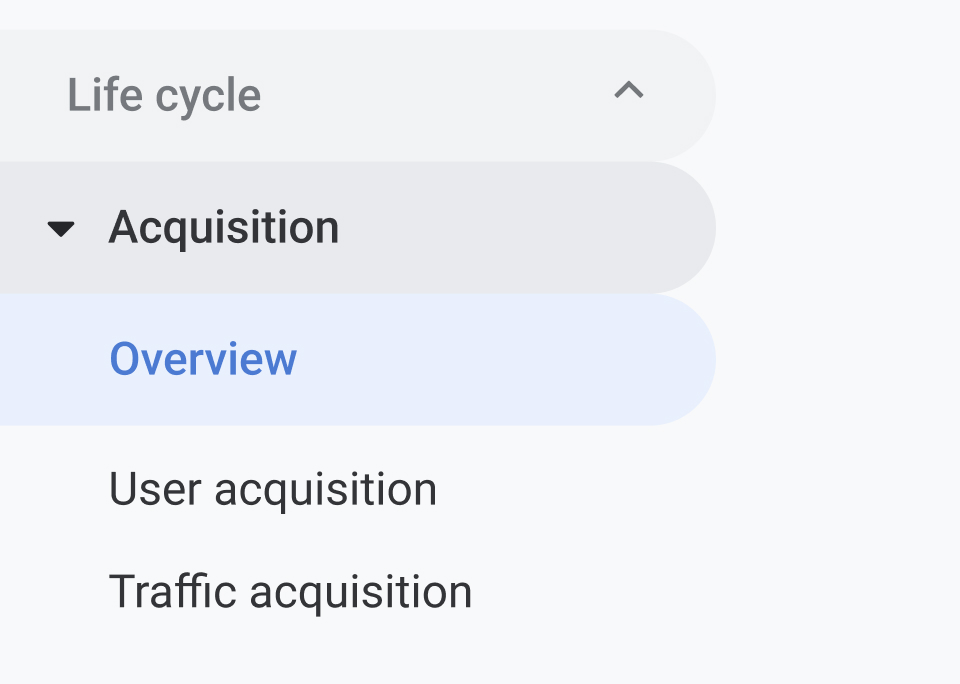
- The “Acquisition” screen gives you a familiar view of new versus returning users and how runners are coming to your website.
“User acquisition” is the screen to pay attention to in this section. This page shows the exact channels your website received traffic—whether that’s from Google (organic), Paid Search (Google or Bing Adwords), Direct (when someone types in your web address), Organic Social (Facebook, Instagram, TikTok), or Email (Email marketing). This is a useful screen for understanding which channel is driving the most traffic, and which channels are the most effective at delivering results (website engagement and registration). You can review a complete list of channels and definitions on Google’s website.

- The “Engagement” screen shows users by their event count. Simply put, this is the amount of time users engage with your site and the number of times they have returned. Key screens to pay attention to include:
- Events: GA4 will set up a variety of events by default, including page views, first visits, and more. This is a useful screen to get a general understanding of what your users are doing on the website.
- Conversions: If you already have conversion events set up on your old Google Analytics account, the automatic transfer may have moved many over. This is the screen where you will find your old conversion tracking and have the opportunity to add new ones.
- Pages and screens: If you are interested in understanding which of your pages are the most popular and how users are finding them, this is the screen where you will find that information. It will break down page views and users by page, their average time on the page, as well as other conversion and engagement metrics.
- Events: GA4 will set up a variety of events by default, including page views, first visits, and more. This is a useful screen to get a general understanding of what your users are doing on the website.
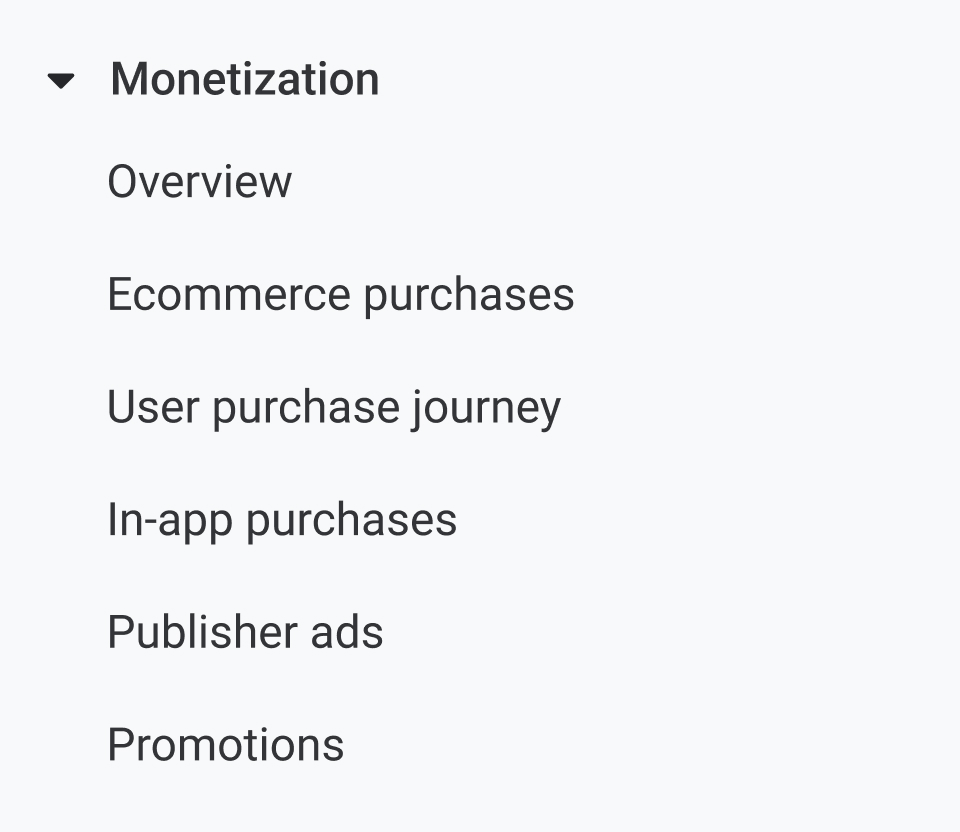
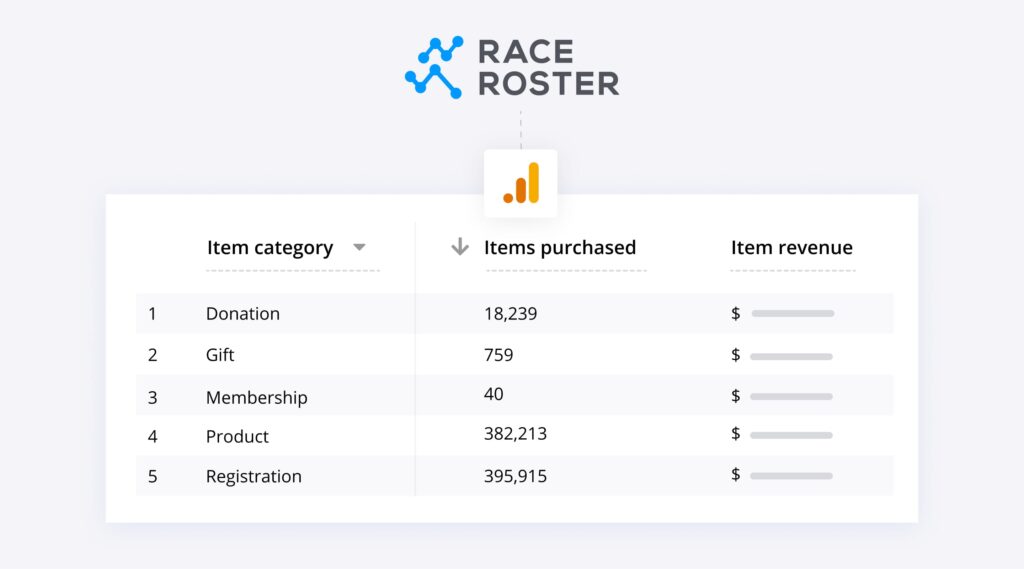
- The “Monetization” screen helps you understand the revenue your website is generating. This screen will track your own e-commerce store but can also accept Race Roster registration data so you have a complete view of your event’s revenue performance.
- We recommend starting with the “Overview” screen as your top-line review. This screen is filled with useful information, including total revenue, what items were bought, how many were purchased, average purchase revenue per user, and much more. Sorting by time will give you a comprehensive overview of your commerce performance. (Note that GA eComm data won’t be dollar perfect. Don’t be concerned if you can’t account for sales down to the 10s of dollars.)
- Finally, the “Retention” screen displays whether your website is turning new users into returning users. While this is useful in some applications, each race will differ in terms of how they use their website and what they expect their users to do. If your website is focused heavily on content and updates and you expect runners to return often, you can check this screen to understand if your runners are doing that. Otherwise, your time is better spent in the “Acquisition,” “Engagement” and “Monetization” sections.
User collection:
The “User” collection allows you to learn about the users who visit your website from a technology and demographic perspective. There are two sections here: “User Attributes” and “Tech.”
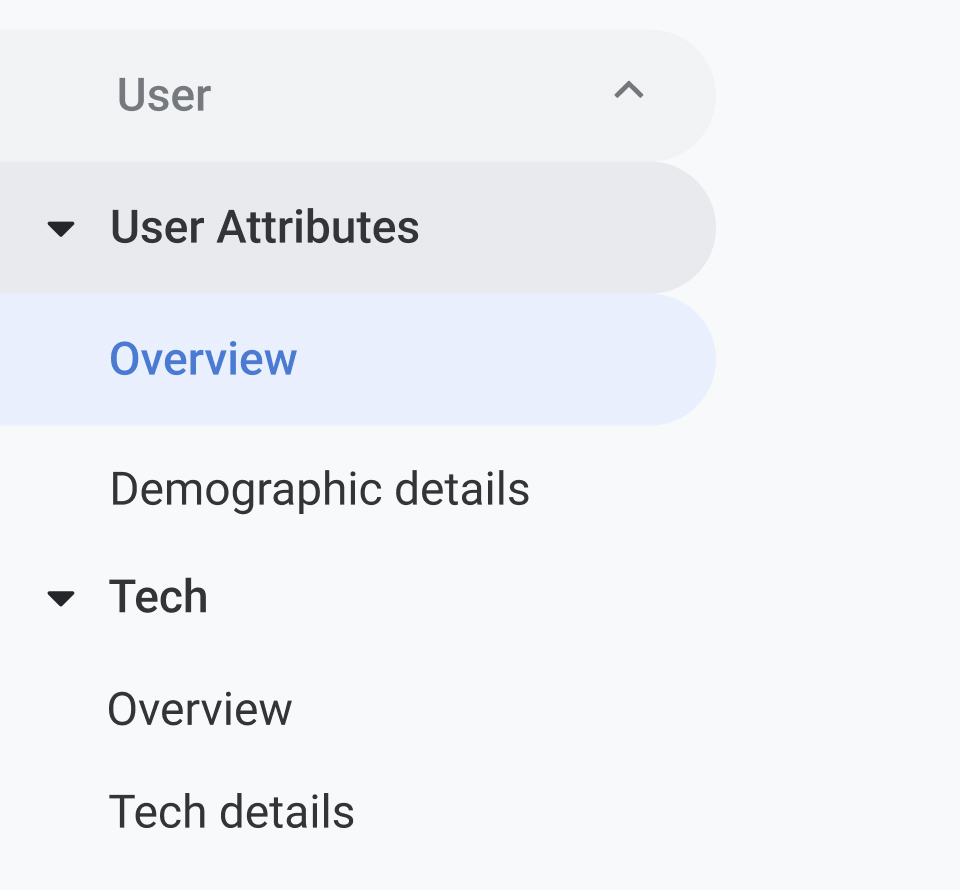
In the “User Attributes” section, we recommend the overview screen. This screen will show you specific details of your runners, including what geographical location they are visiting from, age, gender, language, and other details. This would be particularly useful for you as an event organizer if:
- You have decided to target your marketing in a specific area or towards a specific type of audience (men vs. women, language speaker, etc.).
- You have decided to target your event to a specific age group.
The “Tech” section includes the technologies your runners are using to access your website. Here you can understand the type of web browser, devices (mobile vs. tablet vs. desktop), and screen resolutions your runners use. This screen is not critical to check on a regular basis unless you are going through a web redesign process, or there is a particular concern about the technical accessibility of your website that requires addressing.
Additional Resources
We know that managing this type of technical transition can be challenging. To help you further, we have curated a list of additional resources so you can dive even deeper into the transition if you are interested in learning more.
- If you are a beginner and want a top-to-bottom explanation of the GA4 transition in a simple and approachable way, this tutorial for beginners video is a great jumping-off point. Grab a drink and get comfy—it’s about an hour long.
- If you are more technical and would like a deep dive, long-time SEO guru Neil Patel has an excellent article and a handy GA4 cheat sheet for you to dig into.
- Google provides excellent resources and documentation to manage the transition. For yourself or your ad manager, Google offers a list of links and knowledge articles that cover specific and essential topics. If you are passing this transition to your web developer, handy resources are also available directly from Google.
We hope this article has helped lift the mystery around GA4. If you have a specific question with how your GA4 property will work with Race Roster, we are always here to help.

What’s new at Race Roster?
Visit our what’s new page for the most noteworthy Race Roster updates!