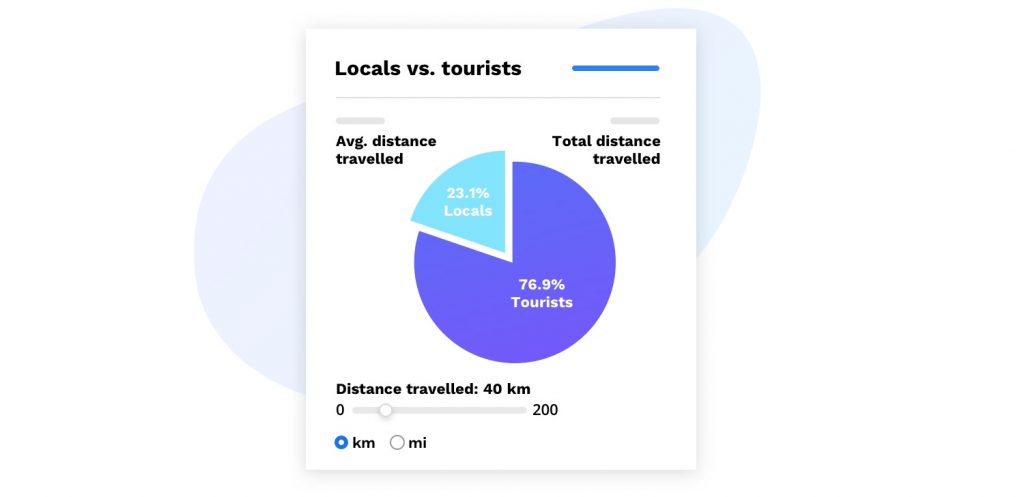
The more information you have about your participants, the better you can accommodate their needs. By using the locals vs. tourist tool, you get a high-level overview of where your participants are coming from, helping you attract relevant sponsors and better understand your audience. Located in the demographics section of your dashboard, you will see a clear and concise pie chart, giving you a visual representation of locals vs. tourists.
Using the ‘distance travelled’ slider located on the pie chart, you can change the radius to reflect the exact distance someone has to travel to your event to consider them a tourist. For example, if your event is taking place in a buzzing metropolis, you can decide if you’ll be including the surrounding areas as locals or not. Here are some great ways to get the most out of the locals vs. tourist tool.
Create personalized marketing campaigns
Understanding the wants and needs of your audience is a powerful way to ensure they are getting the most out of your event. This tool gives you a great insight into what kind of campaigns your participants would best respond to. Once you know the breakdown of locals vs. tourists, you can ensure that you are providing relevant information to your registrants.
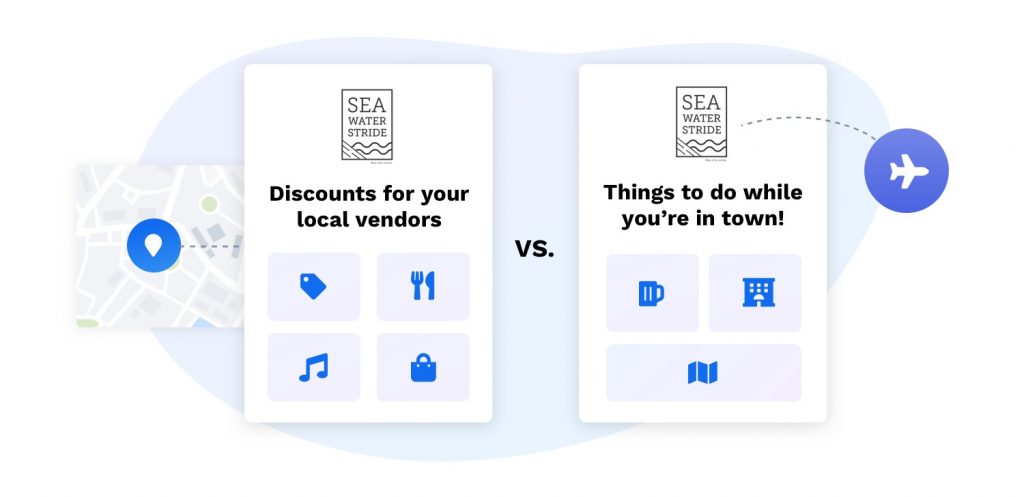
For example, locals will want to hear about hometown bands that will be performing, or what local restaurants will be offering discounts to participants. On the other hand, tourists will need more extensive information, such as hotel recommendations, out-of-town driving directions, places to eat, and where to park.
Create an economic impact report
When communicating with your city’s tourism board, you can use the locals vs. tourist tool to highlight the number of people who will be travelling into the area and spending money on things such as hotels, food, entertainment, etc. With a clear visual of locals vs. tourists, it will be easy to show the potential economic impact of your event.
You are able to illustrate how valuable your event is through both local engagement, and by generating economic activity for the city.

Provide key details to sponsors
The locals vs. tourist tool is a great asset to utilize when speaking with sponsors. By using the data displayed by the pie chart, you can highlight information that may be attractive to potential sponsors.
- Local brands: Showcase your influence within the local community.
- National brands: Emphasize the reach of your event across your state/province.
Whether you are talking to a local or national brand, it’s important to consider their goals and present data that is relevant to them.
Race Roster’s locals vs. tourist tool offers you a variety of benefits when it comes to effectively communicating with your participants, creating economic impact reports, and sharing compelling data to attract sponsors. Ready to get started? Visit our knowledge base article on how to use the locals vs tourist tool.