Registration question metrics

We recently released an all new registration question metrics dashboard. You now have the ability to view a high-level overview of the answers to the questions you’ve asked on your registration form. Having answers in an excel doc is great, but it can take a long time to gather any useful insight. With visual representations in the form of pie charts, it allows you to quickly spot important trends that can influence how you manage your event.
To view your registration question metrics:
1. Go to your Main Dashboard.
2. Navigate to the left-hand side and click “Metrics“.
3. Select “Registration questions metrics“.
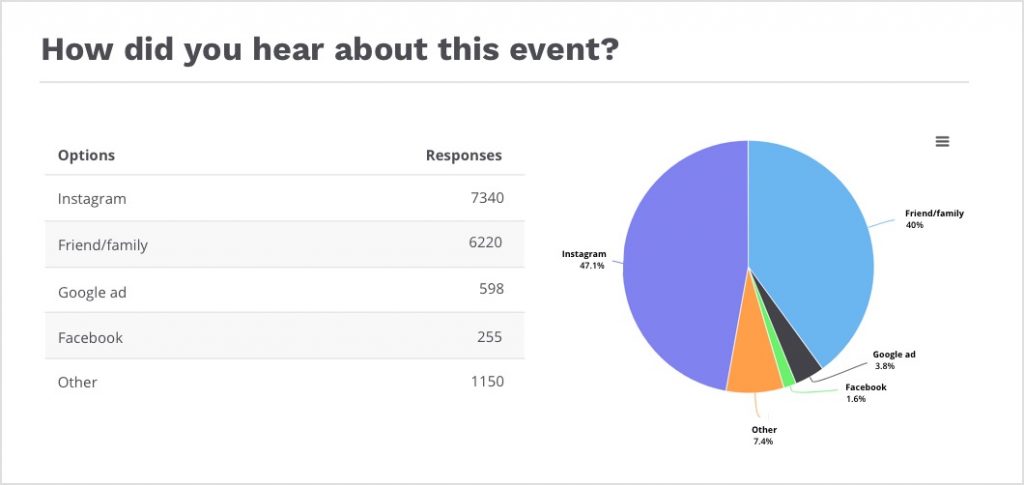
4. You will then see your registration questions and answers displayed in a pie chart format.
To learn more, visit our knowledge base article: Registration question metrics
Articles for you
We’ve put together an article to help you ask impactful questions. Check out this article: 5 great questions you should ask participants to identify race trends via registration question metrics.